Project Dashboard showing Real-time status using DV Tech.
Graphical interactive analytical Dashboards and reports for all functions of a Project like Schedule and Cost performance, Risk, HSE, Quality, Finance etc. during all phases execution in Infrastructure, Oil & Gas, Petrochemicals, Offshore Platforms, Fertilizers, Pipelines and Infrastructures sectors. User friendly dashboards giving summary of key milestones at Unit level as well as for Overall Project.
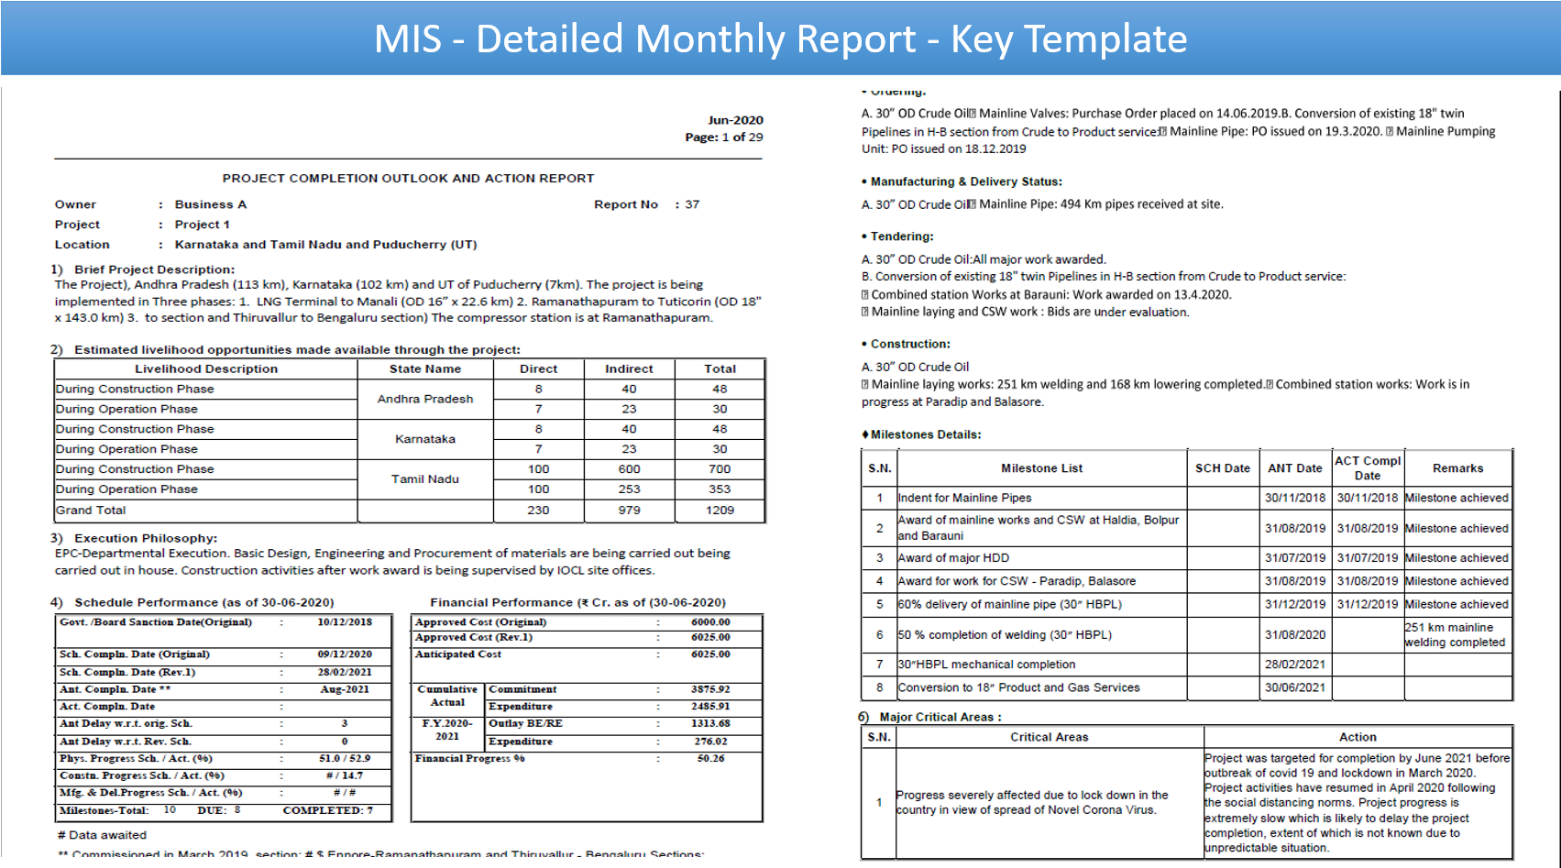
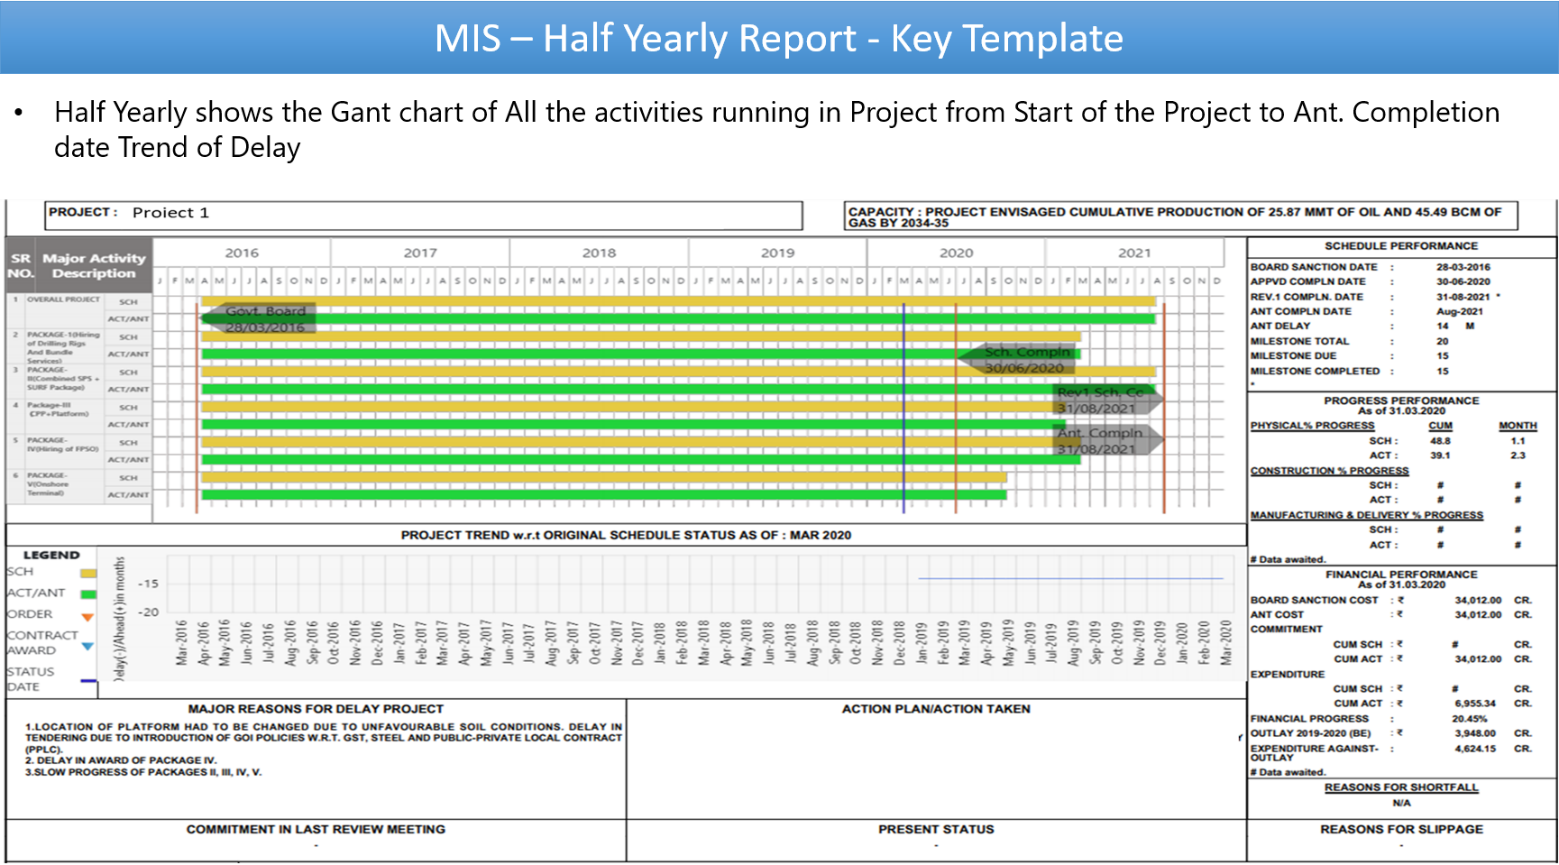
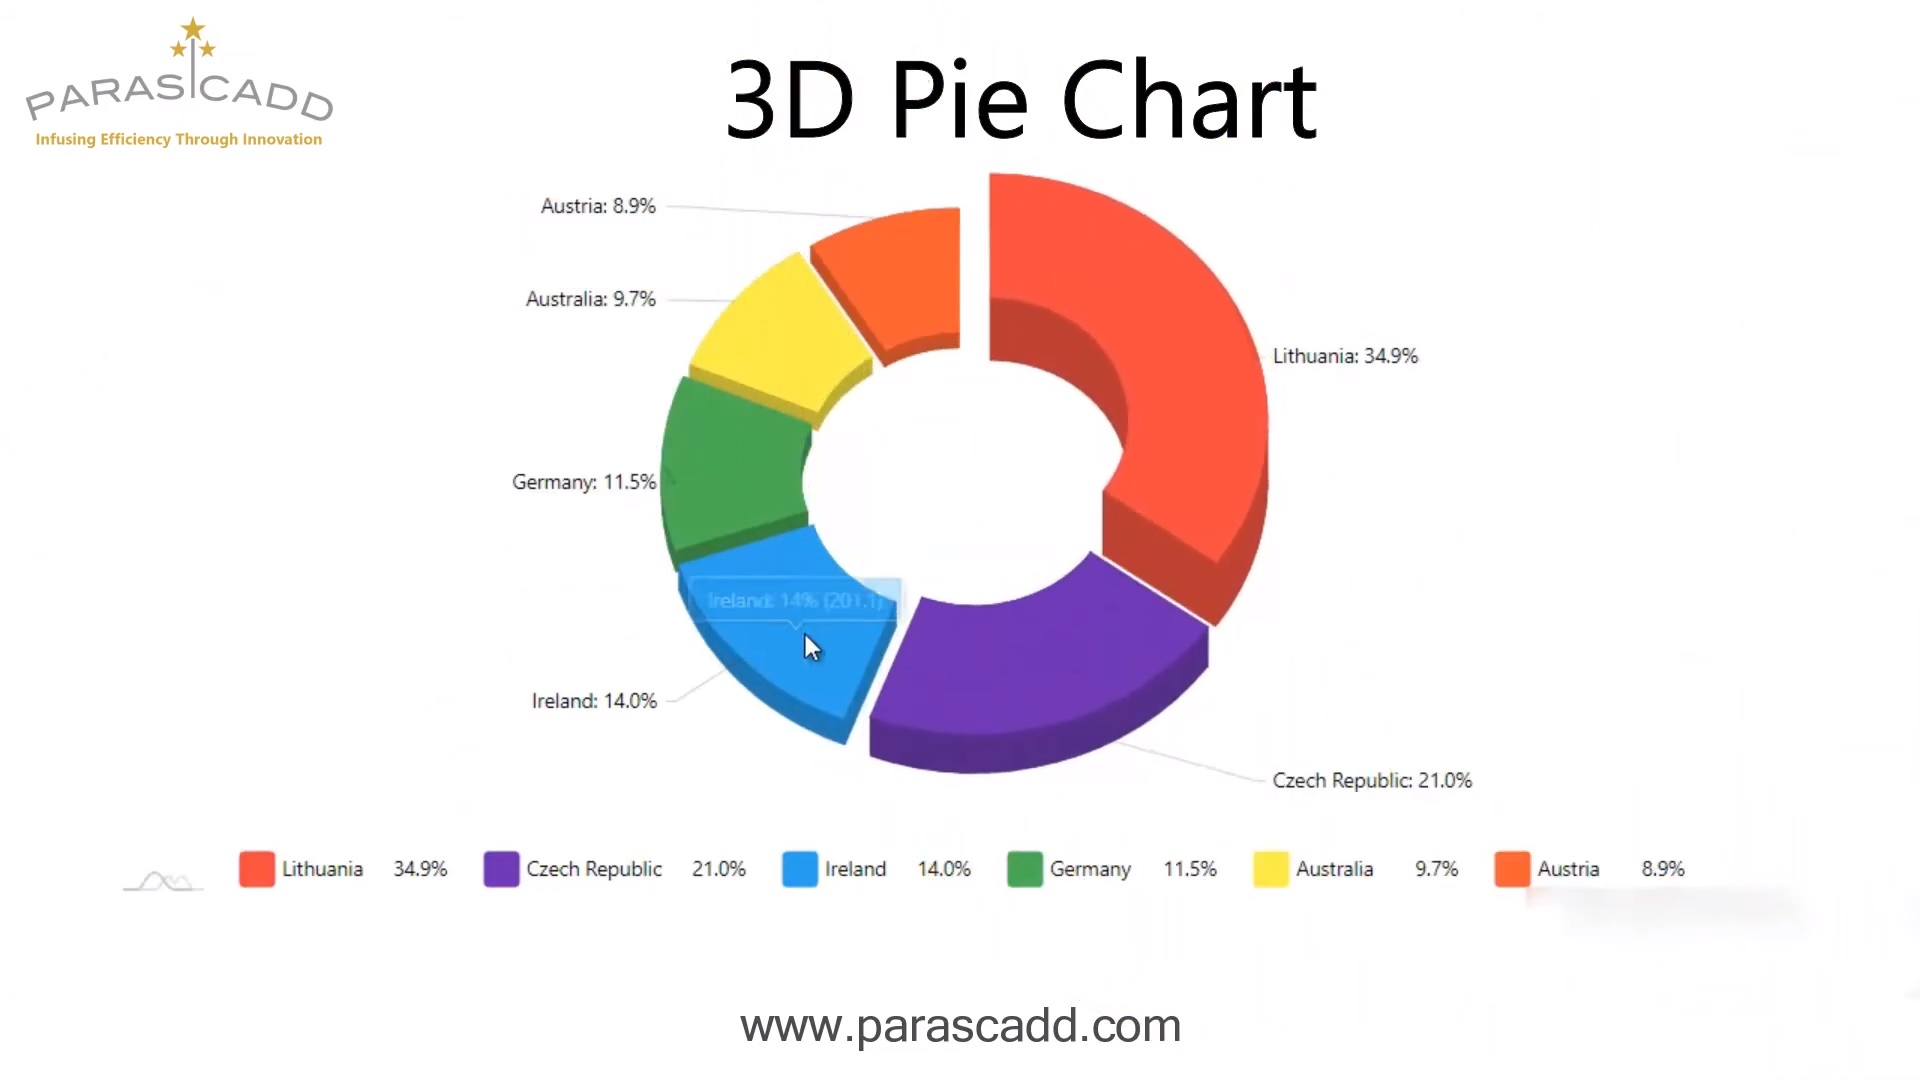
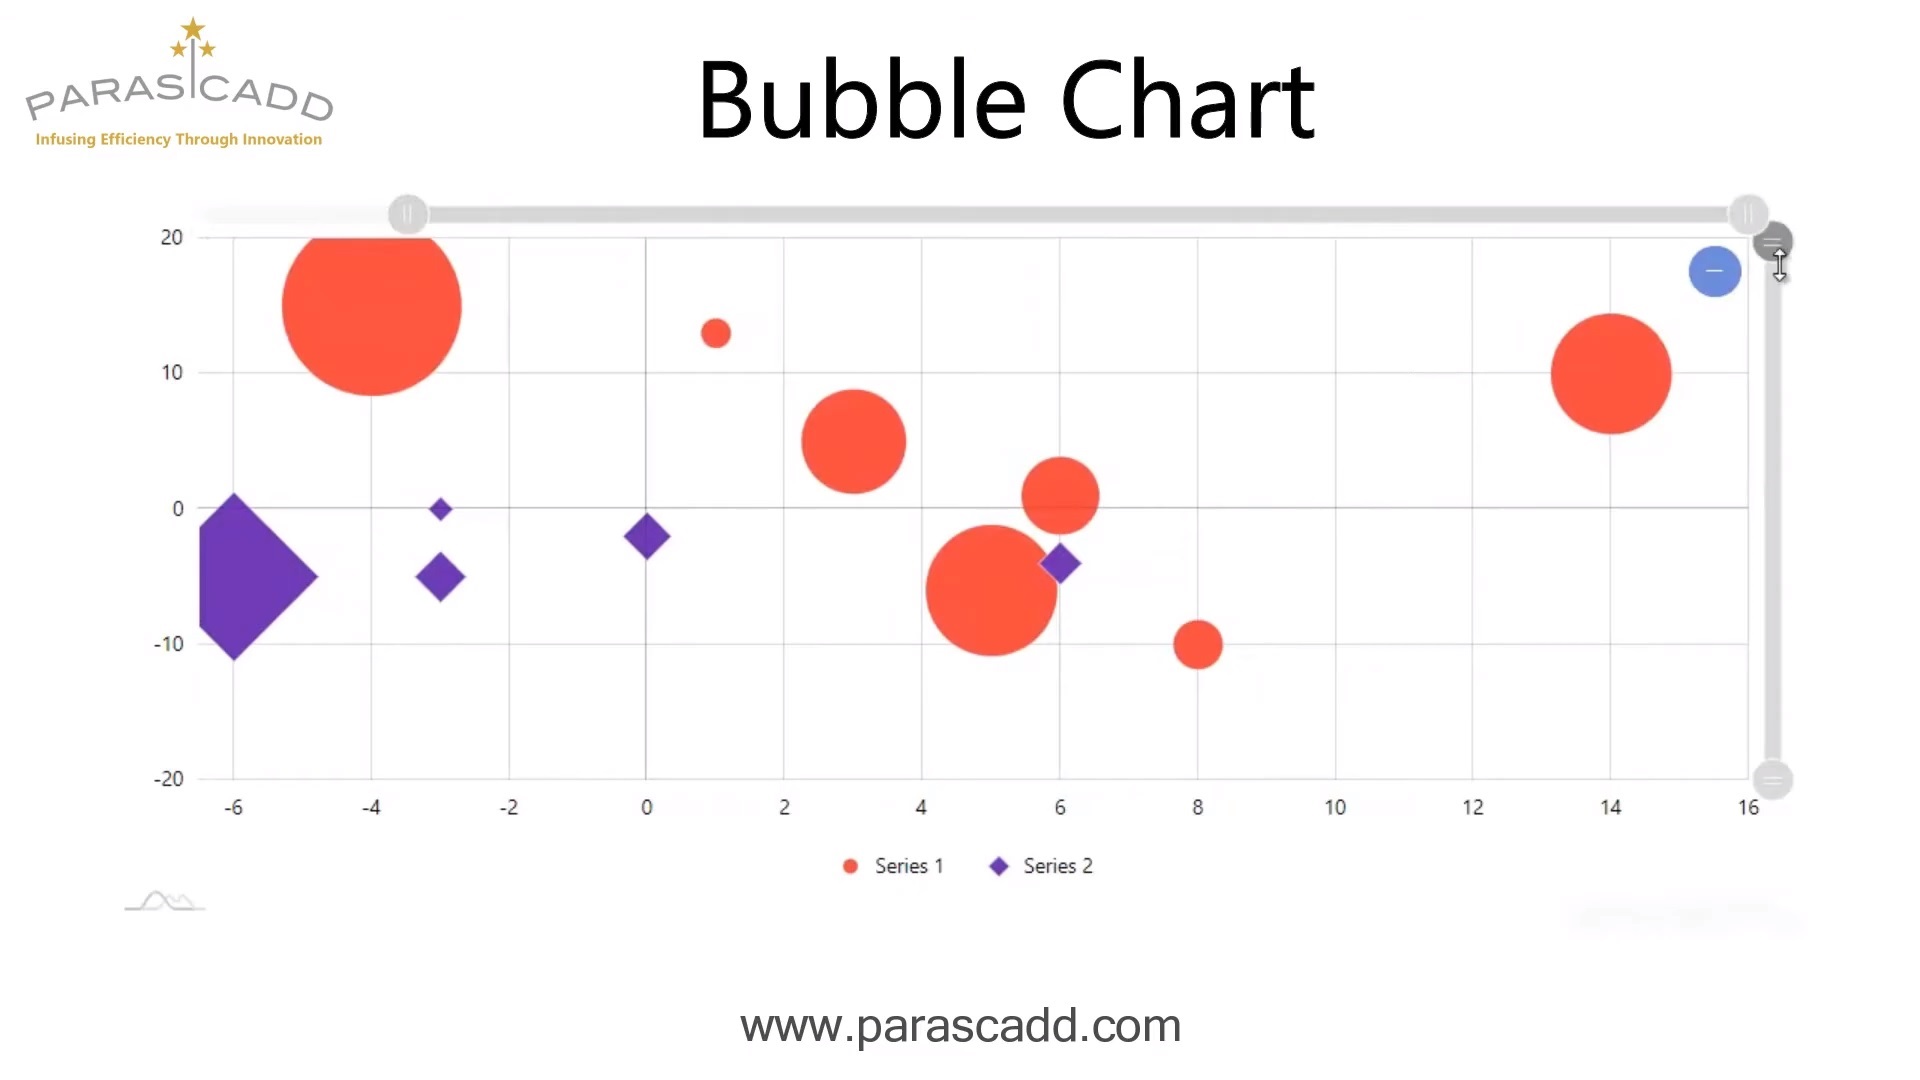
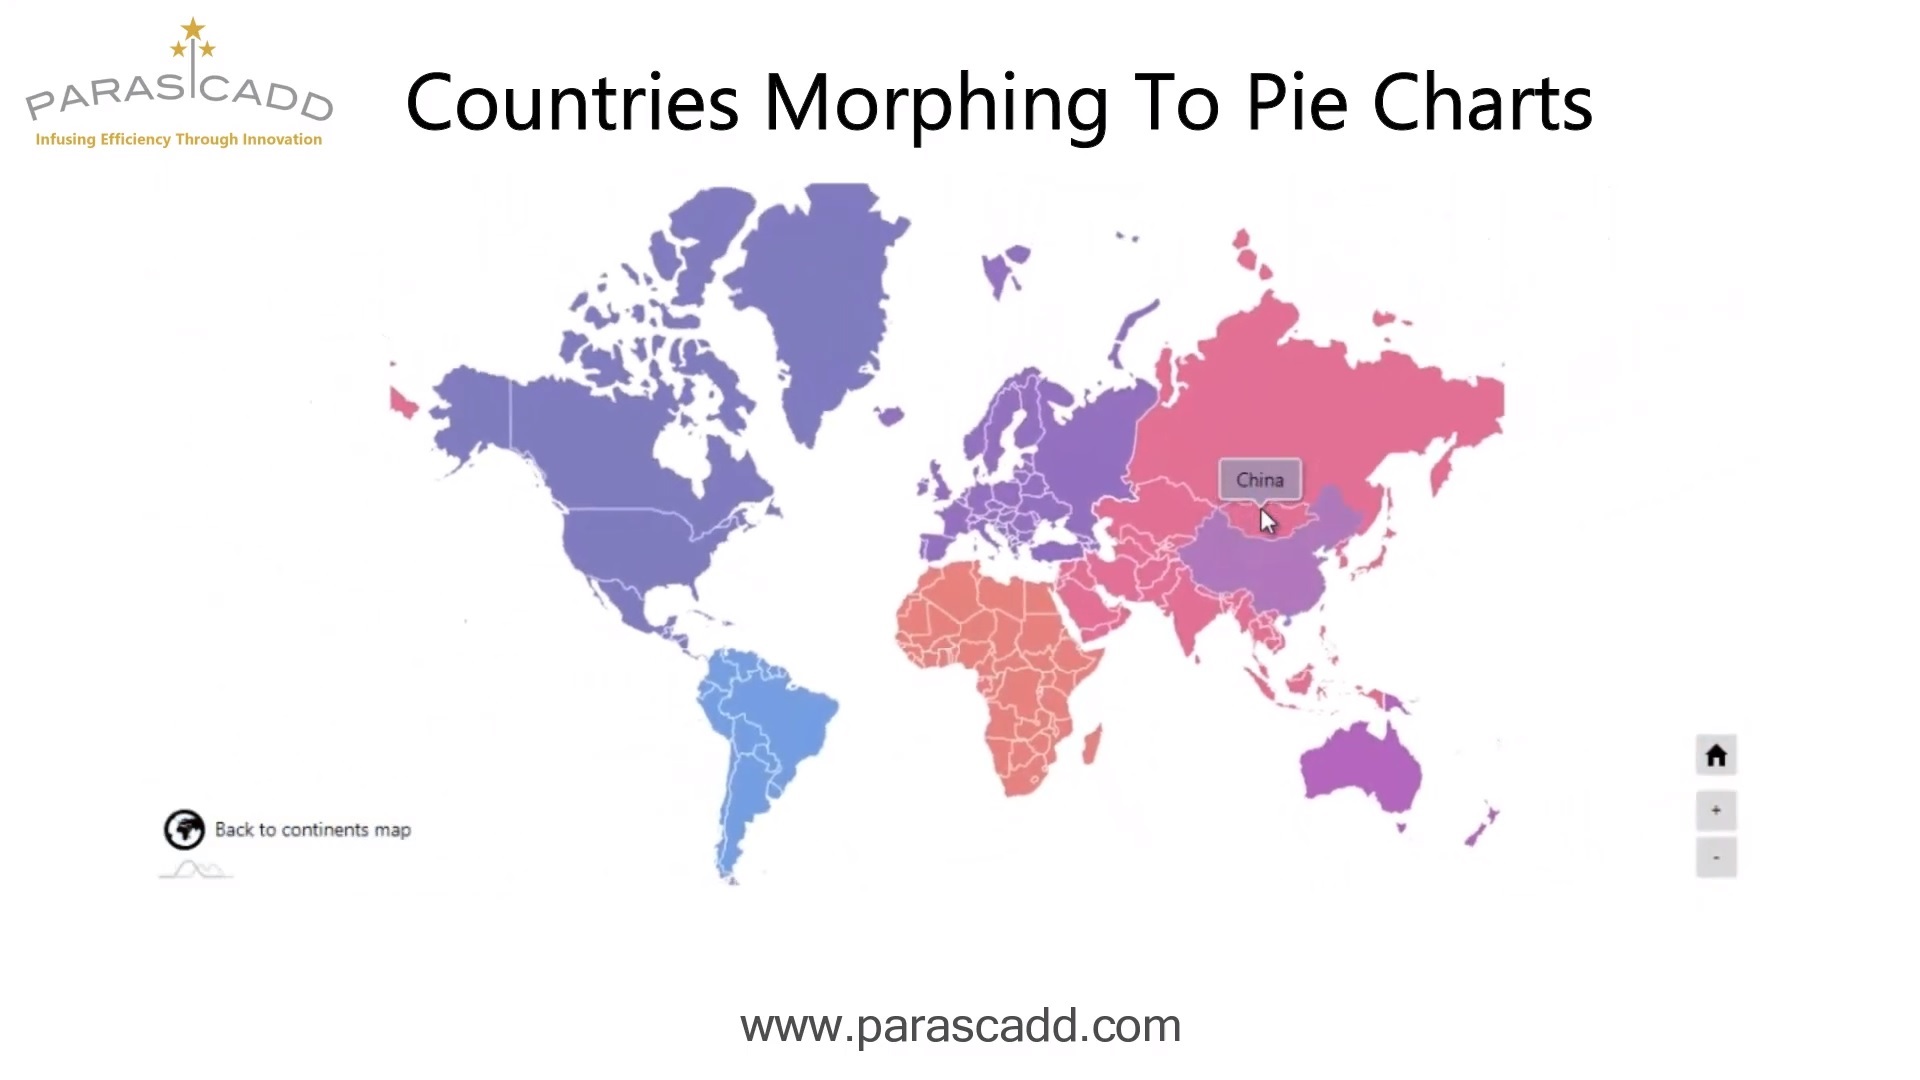
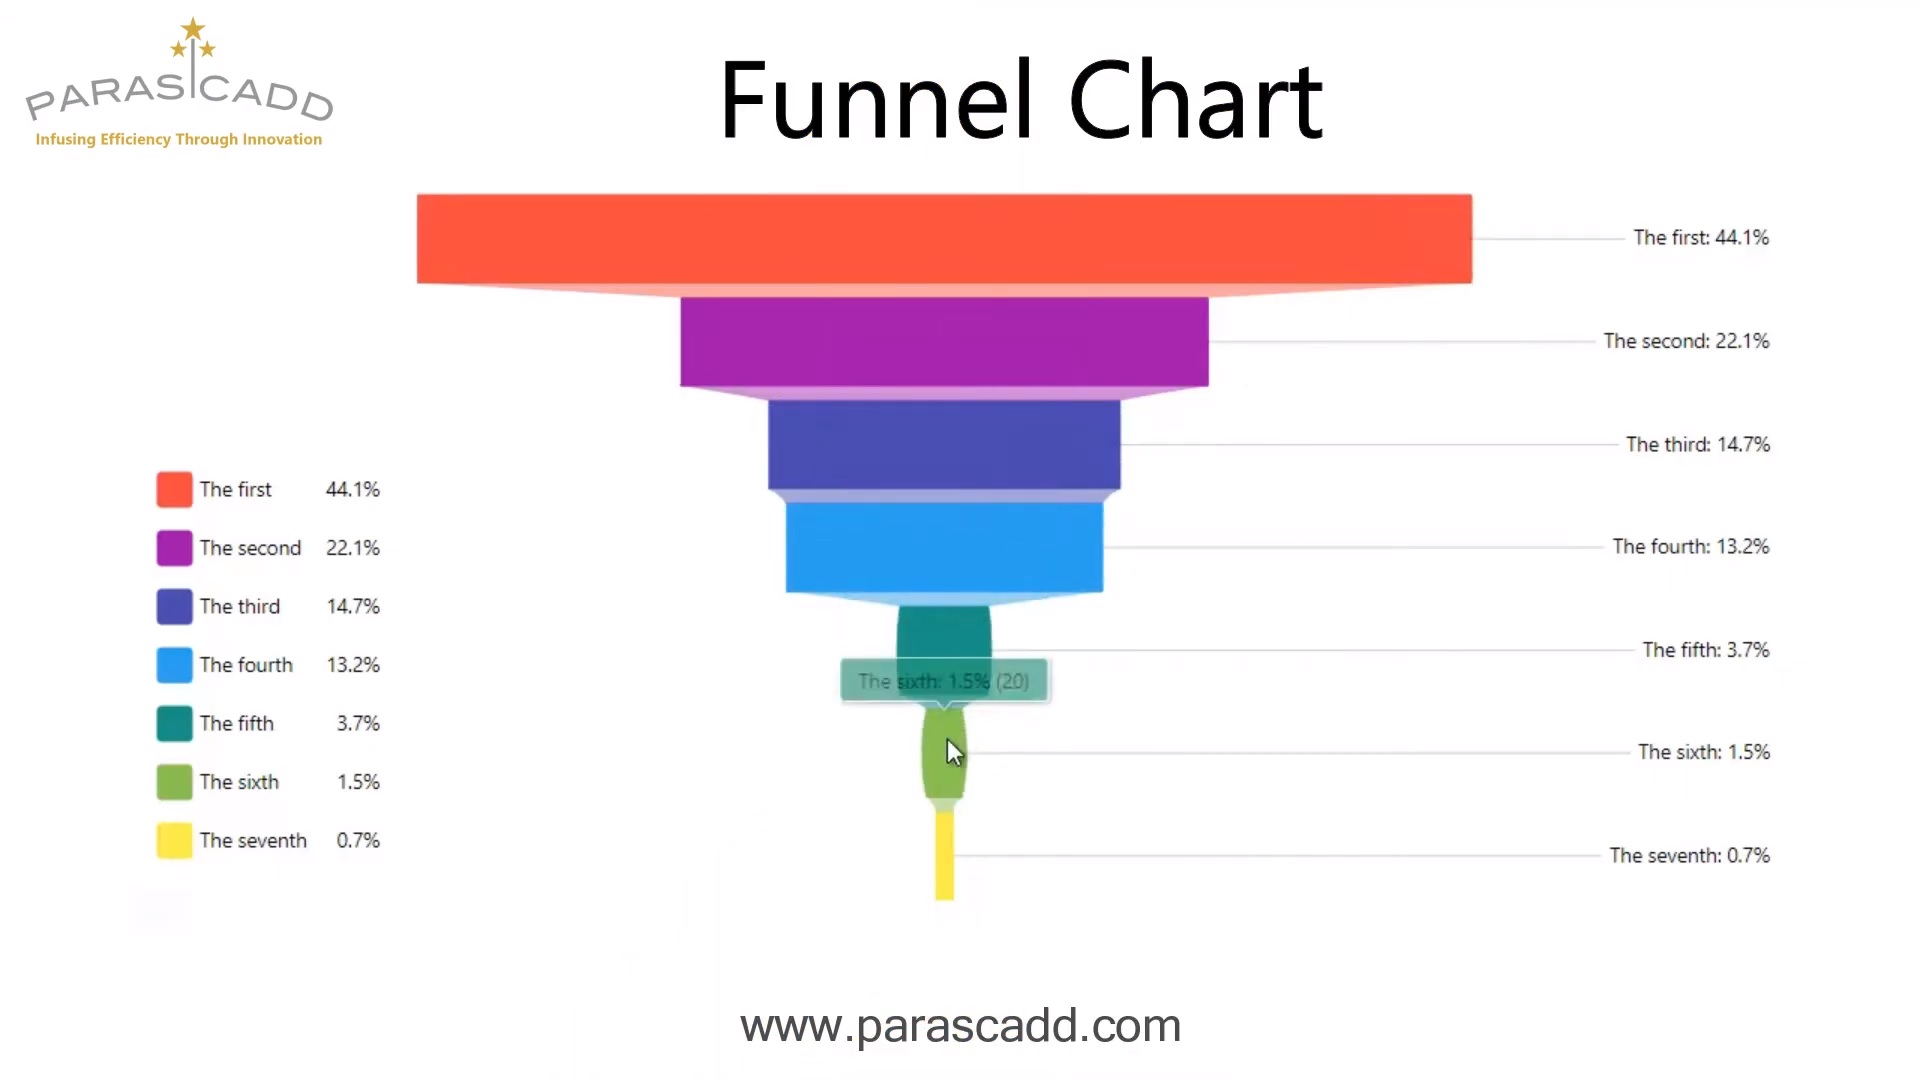
MIS reporting in desired templates with respect to type of industries / sectors, geographical locations, setting criteria like projects ahead of schedules, delayed projects, projects within estimated budget, projects with cost overrun etc. Analysis and reporting of data in the form of Profile Curve, Pie-Charts, Histograms, Ring Chart, Scattered Charts and so on.
A high-level overview of completed and remaining tasks in the project, displayed as a progress chart. A coloured status bar across the top of the card indicating if the project is on track (green), at risk (yellow) or needs attention (red). Status updates or more detailed notes about recent activities, posted by the project owner.
Testimonial
MoPNG uses PRODASH PI (Now ApexMIS) that has been customised to fit their requirements.
Display matrix for a project’s overall project progress and performance, highlight particular problems that require further attention. Display Exception Lists of Activities for delay and look ahead for next 90 days. Provide stakeholders with an overview of a project’s progress, capturing data about team performance, milestone achievements, earn value & efficiency, wherever applicable. As progress is made on flagged items, will allow project managers to use one dashboard display for all their active projects.
Features
Better data management means better decision making
Schedule and Cost performances are the key controlling functions for progress measurement of any nature of the Project. A consistent monitoring of these two functions during all the phases of the project such as Pre-Execution, Execution, Commissioning and Closure etc. decides the health of the project and supports the management in strategic and tactical decision making.
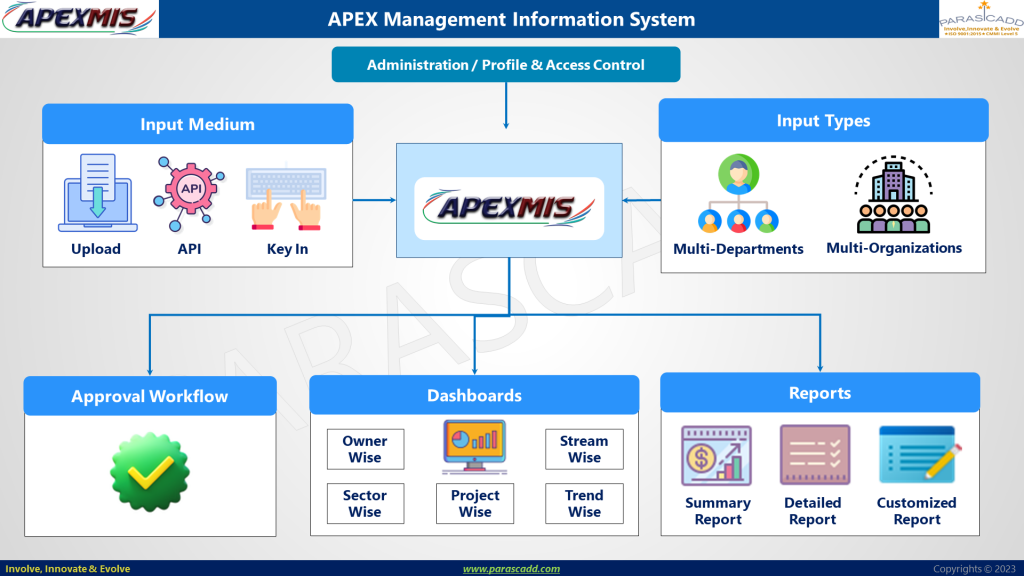
ApexMIS is a web based software application used for recording, analyzing and reporting the data related to progress statuses of the projects. These projects could be of any kind in nature and may belongs to the various sectors such as Oil and Gas Production and Refining, Petrochemical Pipelines, Marketing and Infrastructures, Fertilizers, Manufacturing and Construction etc. and could be undertaken by the government ministries or the private group of companies / agencies.
ApexMIS produces data in an understandable format using graphs and charts to view and monitor by the various project stakeholders.
Why Choose ApexMIS?
To apprise the Management and important stakeholders about status, critical issues and trends.
To highlight actions being taken / to be taken by project execution agencies.
To serve as a central, single point source of information on all ongoing projects to the Management and important stakeholders.
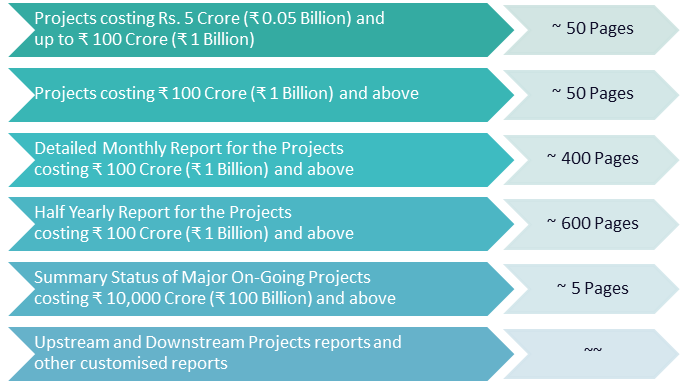
Apprise the Management about the status for the Projects costing in various ranges for example; ₹ 5 Crore < = > ₹ 100 Crore, >= ₹ 100 Crore etc.
Collate the project inputs from executing agencies, review and examine the inputs for preparation of Management reports.
Review the Project Schedule Performance, Engineering, Procurement and Construction progress, Financial Performance, Project Milestones, status of Statutory Clearances, critical vendors etc.
Provide reasons for shortfall in Physical and Financial progress.
To furnish details to the Management for queries from important stakeholders on implementation of projects.
Review and analyze statuses with project executing agencies.
More Features
ApexMIS is an interactive dashboard software created using the latest data visualization technologies to graphically display parameters of EPC project .
User-friendly dashboards giving a summary of key milestones at the Unit level as well as for Overall Project.
MIS reporting in desired templates with respect to the type of industries/sectors, geographical locations, setting criteria like projects ahead of schedules, delayed projects, projects within estimated budget, projects with a cost overrun, etc.
Analysis and reporting of data in the form of Profile Curve, Pie-Charts, Histograms, Ring Charts, Scattered Charts and so on.
The display matrix for a project’s overall project progress and performance, highlight particular problems that require further attention. Display Exception Lists of Activities for delay and look ahead for the next 90 days.
Provide stakeholders with an overview of a project’s progress, capturing data about team performance, milestone achievements, earn value & efficiency, wherever applicable.
As progress is made on flagged items, it will allow project managers to use one dashboard display for all their active projects.
A high-level overview of completed and remaining tasks in the project displayed as a progress chart.
A colored status bar across the top of the card indicating if the project is on track (green), at-risk (yellow) or needs attention (red).
Status updates or more detailed notes about recent activities, posted by the project owner.
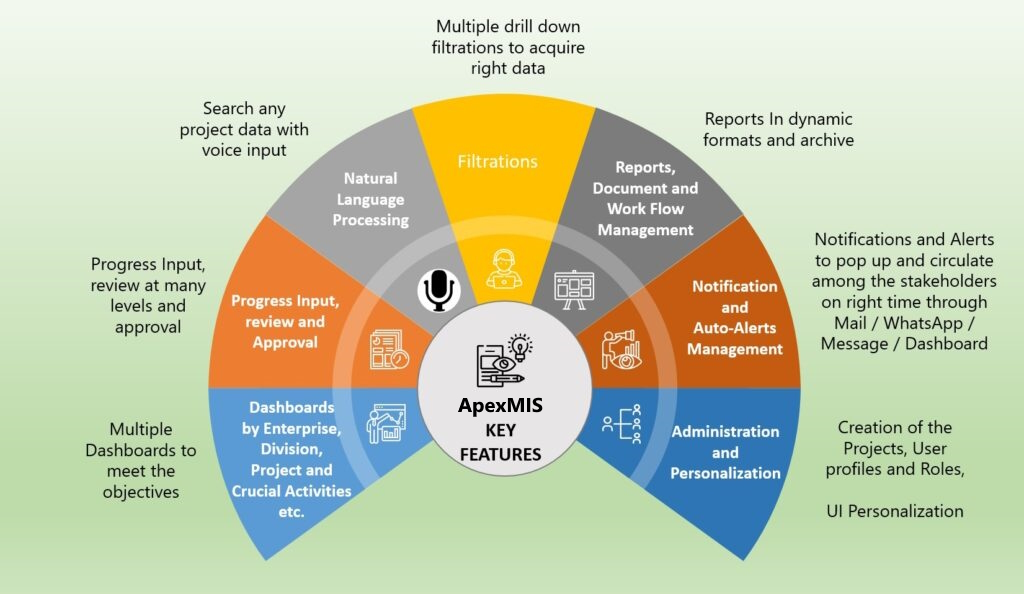
MIS features
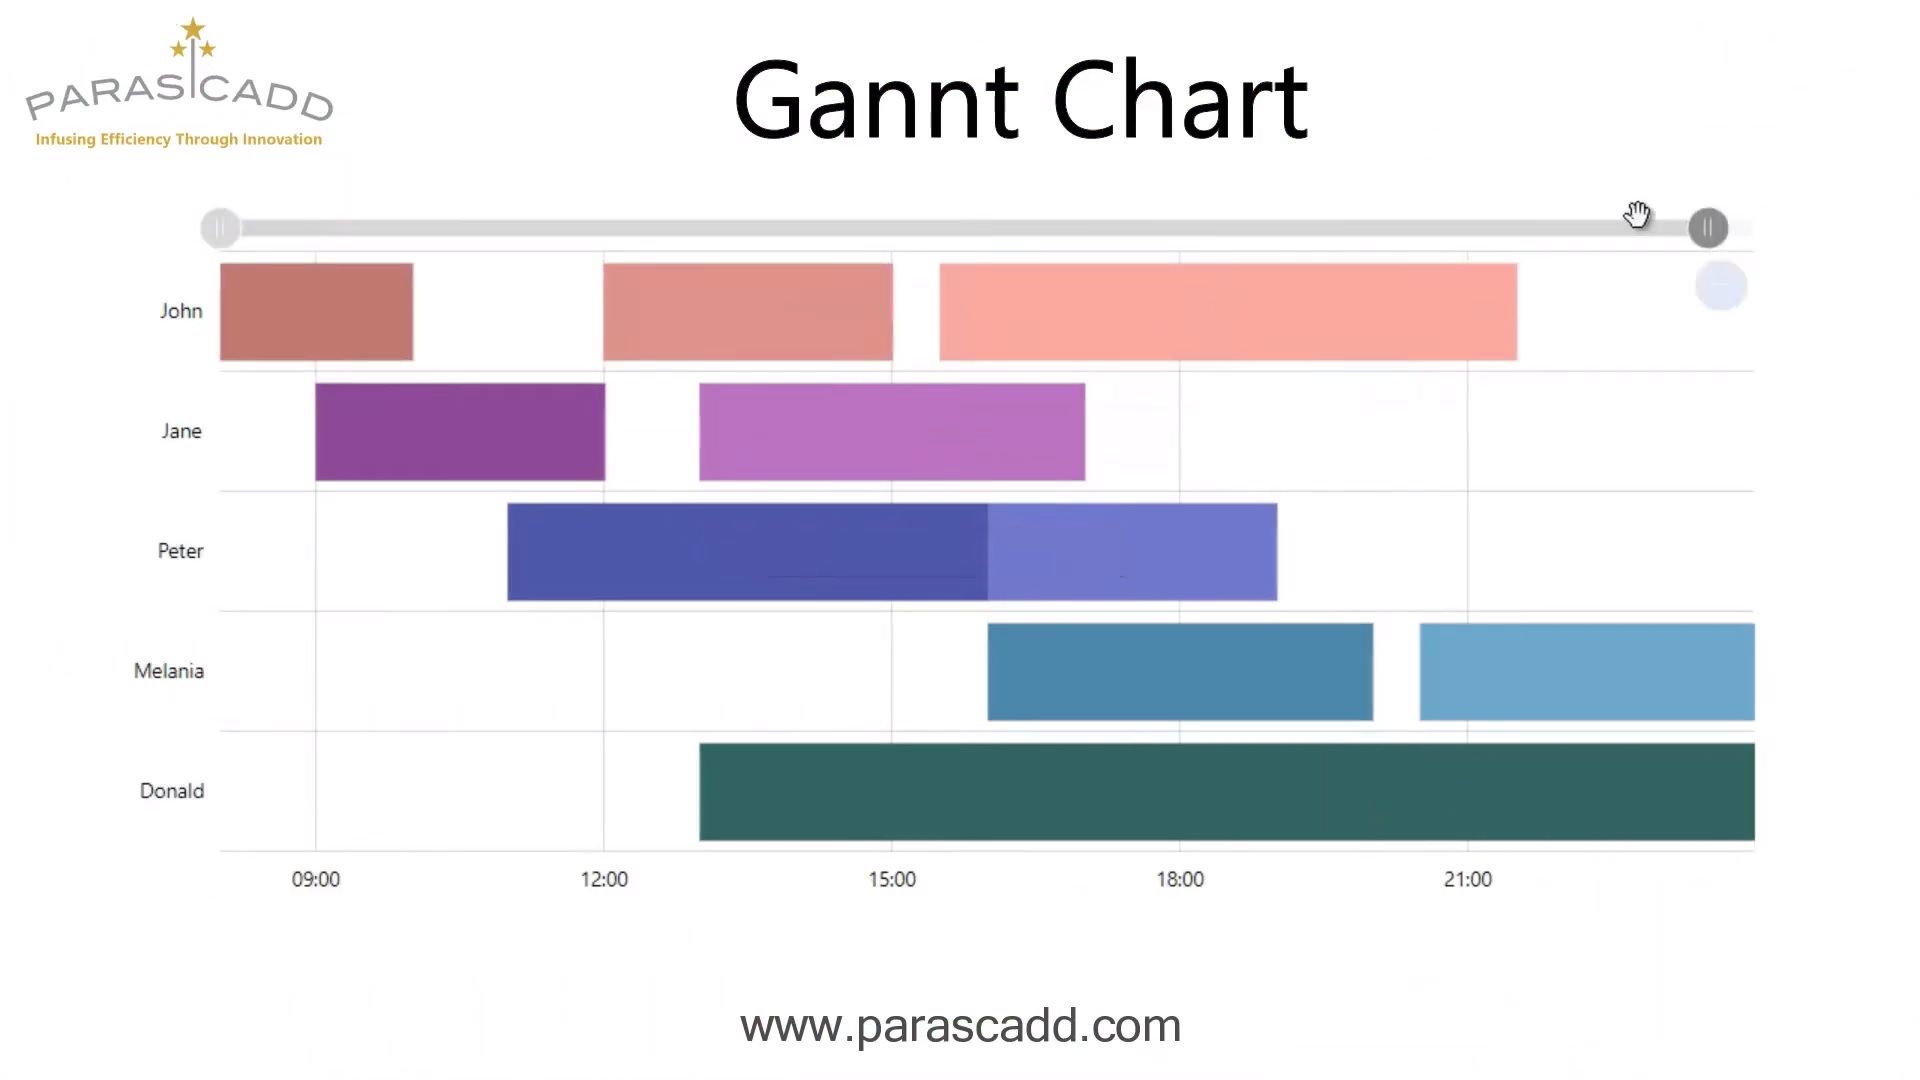
ApexMIS can be used for MIS reporting to aid top level management with Project Physical Progress, Financial Progress, Cost Overruns, Schedule Overruns, Cost Variances, Schedule Variances and other monitoring parameters. These parameters are graphically represented through colorful appealing Charts, Curves.
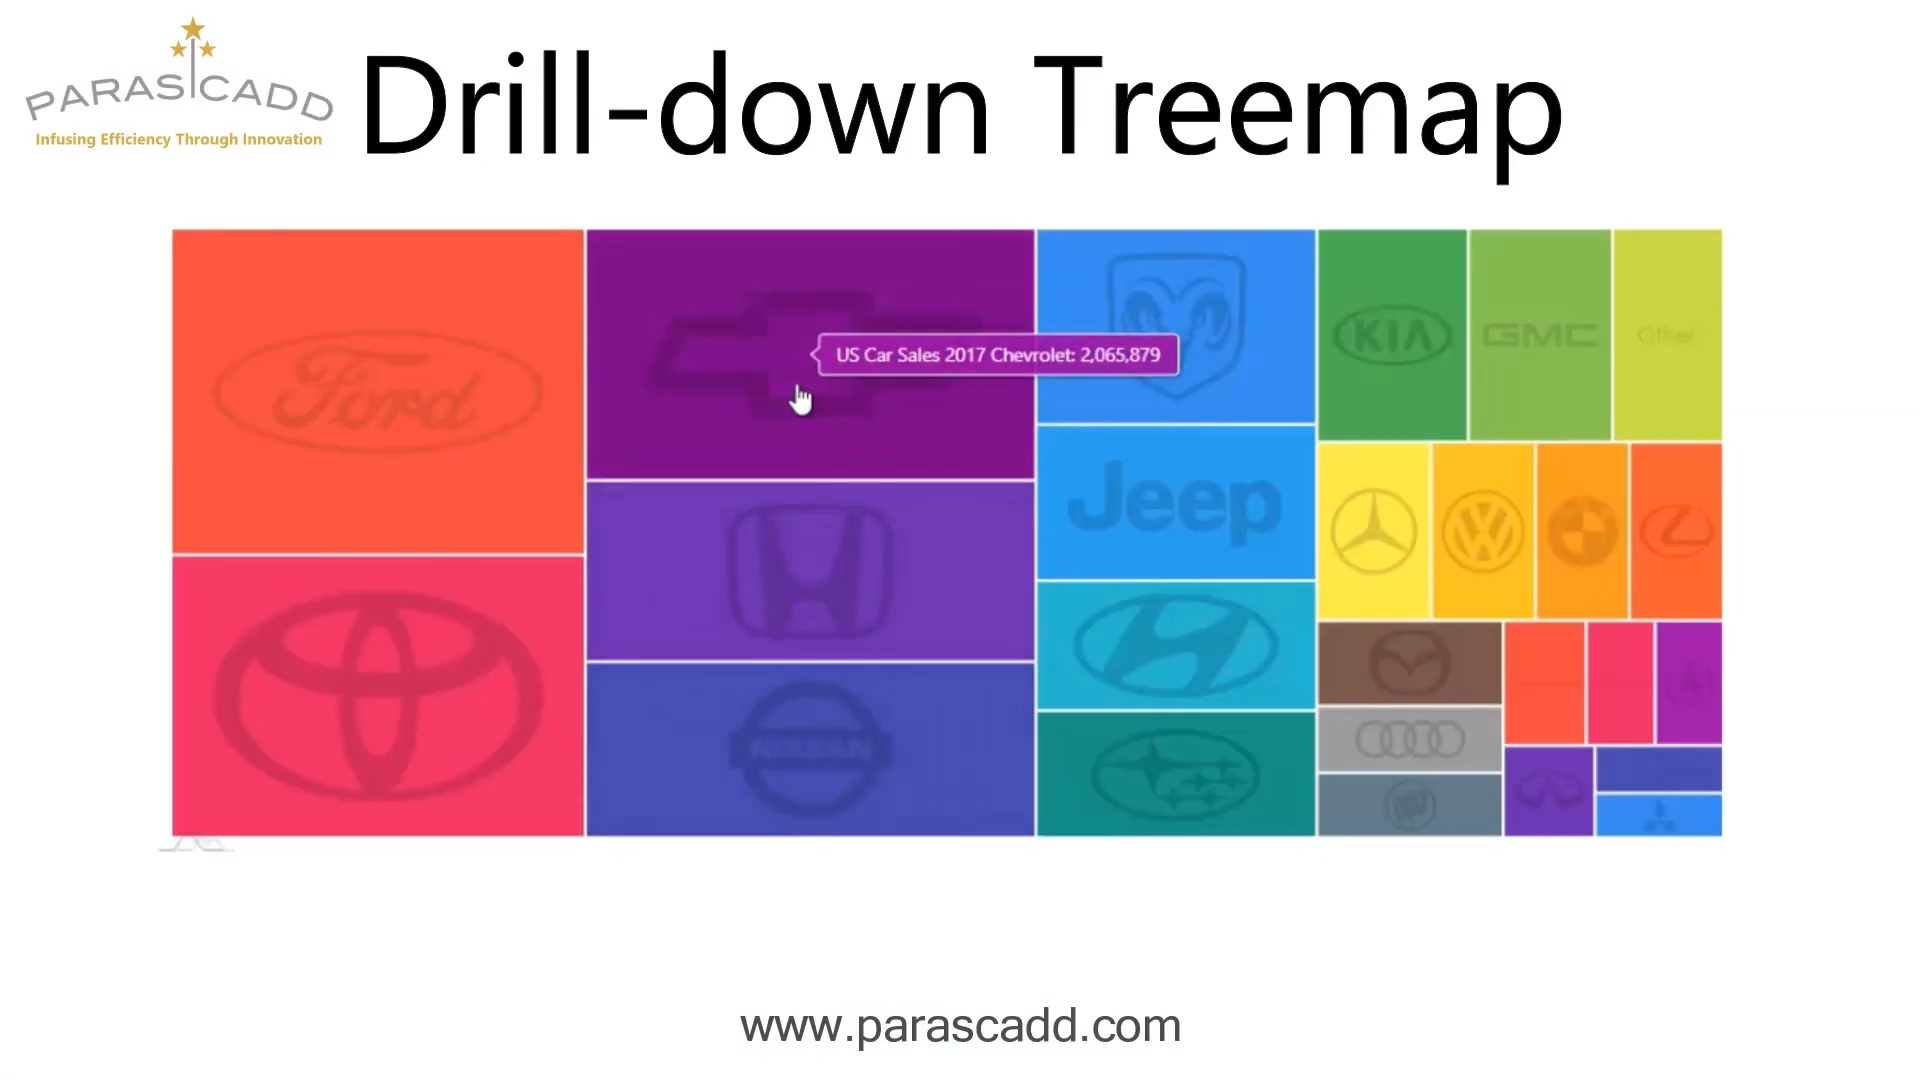
We have also provided with features such as Drill down, slice & dice. Projects can be monitored Sector-wise, Client-wise, Location-wise using GPS features on the maps. ApexMIS provides Analyzed Data in readymade results, represented in graphical form. This data is dynamically rendered.
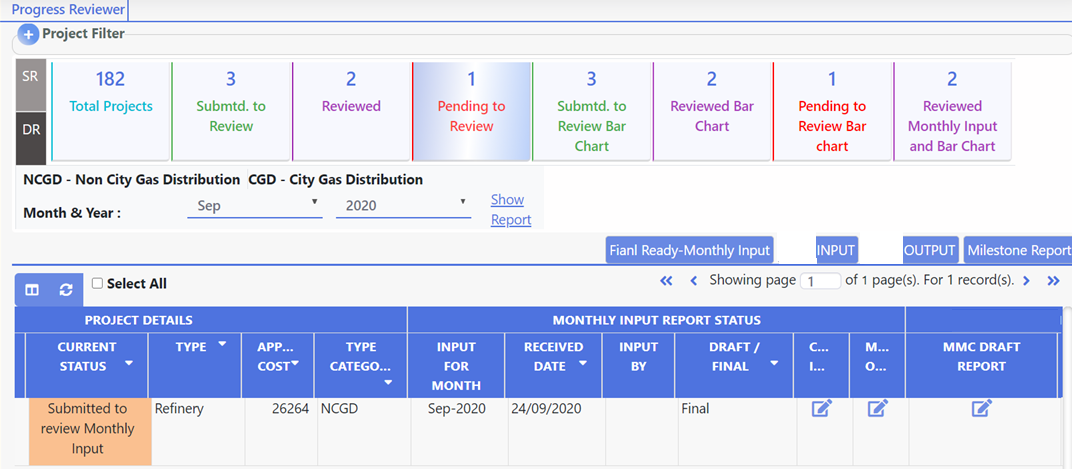
Project Cell reviewer process and Major MIS Reports
Benefits
Improvement in the company’s performance and speed of the business decision making through streamlined ApexMIS data visualization techniques
Transforms company data into real time data metrics rich visuals
Generates the reports in the understandable formats and usable to all hierarchal levels of people
Document centralization and accessible to download to authenticated peoples with just one click
Project progress card as of calendar date on one click
Progress data comparison while recording, reviewing and approving